Building a Market Data Visualization System: Multi-Symbol Data Simulation with uniapp Frontend Deployment Notes
Building a Market Data Visualization System: Multi-Symbol Data Simulation with uniapp Frontend Deployment Notes
Disclaimer: This article is for technical education and demonstration only. It is not professional or financial advice. Any real-world deployment must comply with applicable laws and regulations.
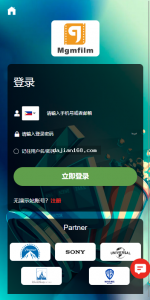
Last week a friend who runs financial training courses reached out asking for a visualization system to demonstrate market trends, something he could use to teach students how to read candlestick charts and interpret market data. I happened to have a ready-made source package on hand, with a uniapp mobile frontend, Vue PC frontend, and fully open-source PHP backend, so I went ahead and deployed the whole thing. Hit a few snags along the way and picked up plenty of details worth sharing for anyone working on similar projects.
Let me be clear upfront: this stack is positioned as a financial data visualization demo platform, intended for teaching, demo presentations, and market data simulation. It does not involve any real funds, and its purpose is purely to build out fairly complete frontend interactions like market charting, order flow visualization, and multi-symbol switching.
Overall Tech Stack and Directory Structure
After unzipping the package, it comes to about 300MB, split into four main directories: admin (backend panel), api (PHP endpoints), h5 (uniapp compiled output), and pc (Vue frontend). The backend is built on ThinkPHP 5.1, MySQL 5.7 is enough to run it, and PHP versions between 7.2 and 7.4 are the most stable. Anything above 8.0 throws a handful of deprecation warnings.
Two Separate Frontends
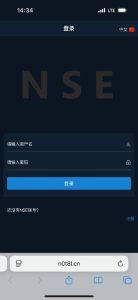
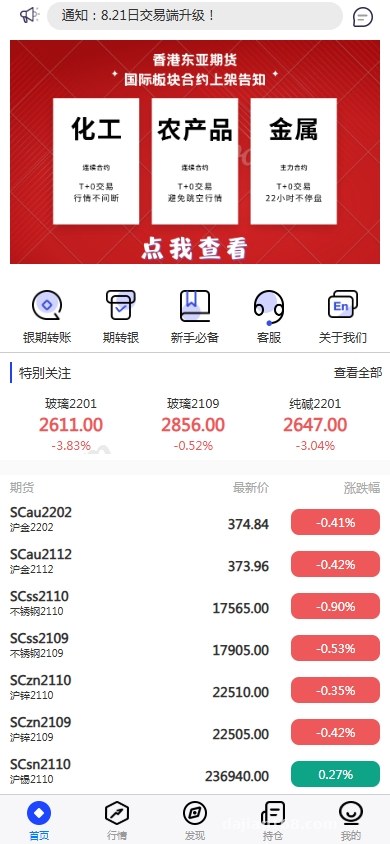
The mobile side is written in uniapp. Just open it in HBuilderX and you can compile to H5, mini-program, or App from the same source. The PC side is a standalone Vue 2 project using element-ui for admin components, bundled with webpack. The upside of this dual-frontend architecture is that mobile and PC UIs can each be optimized independently. The downside is that any single feature change needs to be synced on both sides, so keep that in mind for secondary development.
Backend API Layer
The API follows a RESTful style, with token authentication placed in the header, and market data pushed through WebSocket long connections. The source code reserves interfaces for data sources. For my actual deployment, I hooked in a simulated data generator that uses a cron task to write a batch of randomly fluctuating market values into Redis every 3 seconds, and the frontend just subscribes to the push.
A Few Pitfalls During Deployment
Let me walk through a few real issues I ran into so you can avoid them.
Nginx URL Rewrite Rules
The routing rules for the admin directory are not fully written by default, so accessing any second-level page directly returns a 404. You need to add try_files $uri $uri/ /index.php?$query_string in the server block. The Vue PC frontend running in history mode needs the same treatment.
WebSocket Port
The market data push runs on port 2346 by default. Remember to open it in the aapanel firewall, and add a separate rule in the cloud server security group as well. The first time I deployed it, the charts stayed frozen and it took me half an hour to realize the port was being blocked.💡 Quick tip: If you access the site through an HTTPS domain, WebSocket must upgrade to WSS, otherwise Chrome will block the mixed content. I recommend using Nginx as a reverse proxy to forward WSS traffic to the internal port 2346, so the frontend only needs to hit 443.
Database Character Set
The SQL file is encoded in utf8mb4. Before importing, confirm the default character set of your MySQL install, otherwise any user nickname containing emoji will fail to insert with an error.
Hands-On Look at Core Features
I ran through the main modules and here’s how they actually feel in use.
Market Chart Module
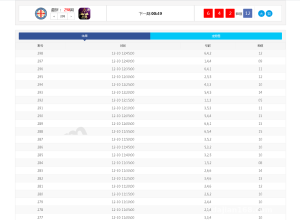
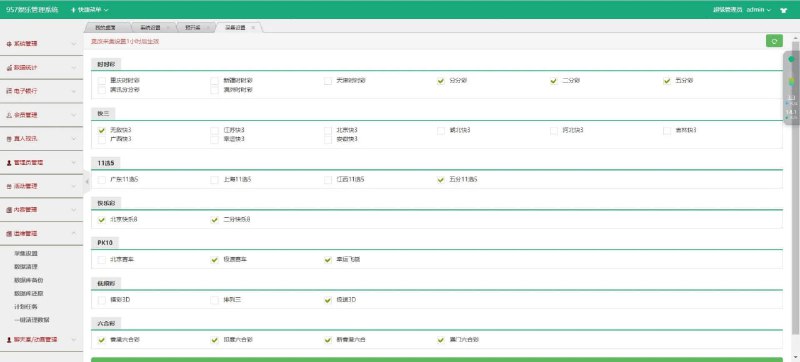
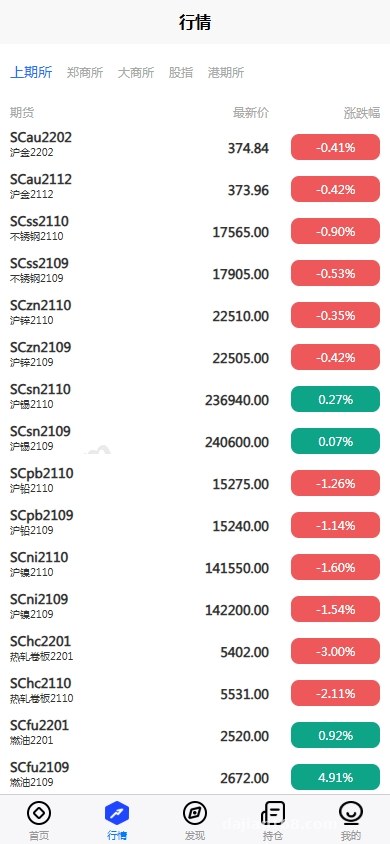
Charts use ECharts paired with a custom candlestick component, supporting time-share, 1-minute, 5-minute, 15-minute, 1-hour, and daily interval switching. Chart interactions are smooth, and zooming, crosshair cursor, and indicator overlays (MA, MACD, BOLL) all work out of the box. Symbol switching is done through a dropdown, and the admin panel controls which symbols are displayed, including simulated stock indices, simulated forex pairs, and digital asset demo symbols.
Demo Order Simulation
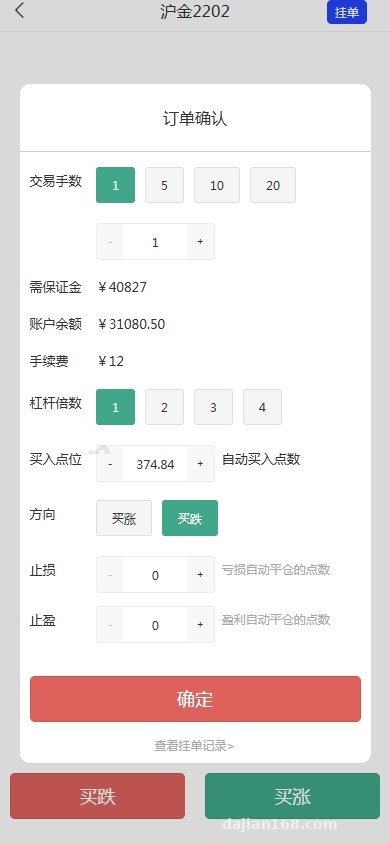
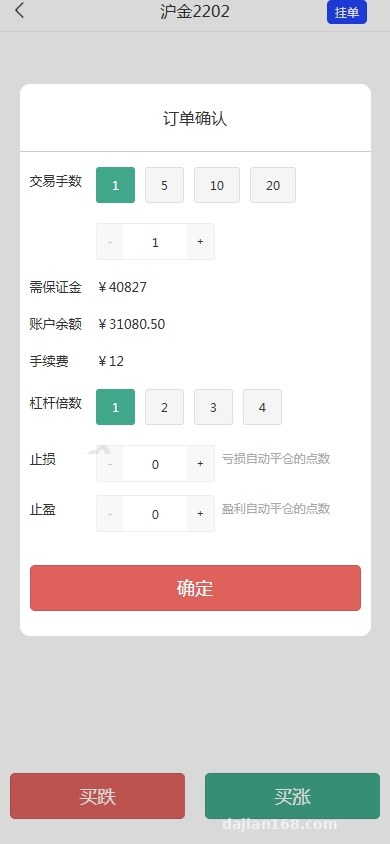
Users can place demo orders and go through the full open, match, and close lifecycle, but the funds are entirely virtual points. This makes it very suitable for demonstrating order lifecycles. The admin panel shows each user’s simulated activity history, which is handy for teaching reviews.
Multi-Language Switching
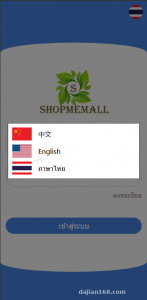
The frontend integrates i18n and comes with Chinese and English by default. Language packs live in the locale directory as JSON files, so adding a new language is just a copy-and-translate job. I added Traditional Chinese for a client in about ten minutes.
Admin Dashboard
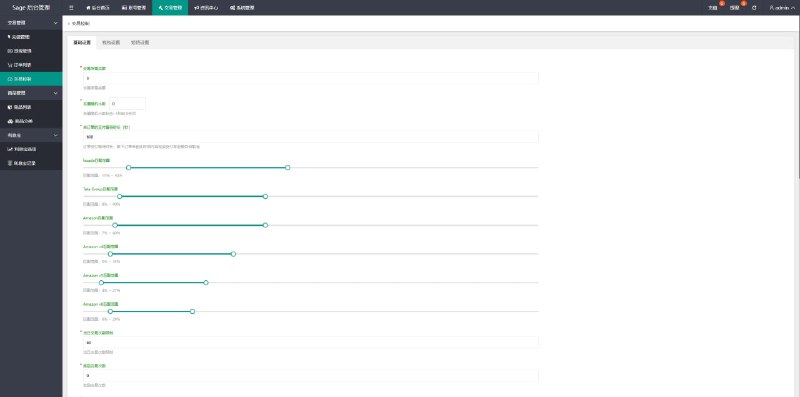
The admin backend is fairly complete, with member management, symbol configuration, demo balance adjustment, announcement push, and chart parameter settings all accessible through the UI. The permission system uses an RBAC model, so you can create sub-accounts with different permission levels for operations, support, and finance roles.
What Scenarios Fit Best
Personally I think this source package fits three types of needs:
First, financial training institutions can use it to demonstrate market trends and chart analysis methods to students, who can practice in a demo environment without worrying about real money risk.
Second, fintech companies building demos can use it to show investors or clients their technical capabilities. A complete frontend and backend package is far more convincing than a slide deck.
Third, secondary development projects, because the PHP + Vue + uniapp combo has a low entry barrier, the source code is reasonably commented, and customization costs stay manageable.
FAQ
Q: Can the uniapp frontend also be packaged as an App?
A: Yes. Use HBuilderX’s cloud packaging feature, and you can build installers for both Android and iOS. iOS requires an Apple developer account, while Android generates an APK directly. Remember to configure the appid, icon, and splash images in manifest.json before packaging.
Q: Can the PHP backend be upgraded to 8.x?
A: ThinkPHP 5.1 does not play perfectly with PHP 8 and will spit out a pile of deprecated warnings. If you want to run PHP 8, I recommend upgrading the framework to TP6. The migration is not huge, mainly involving namespace and route definition adjustments. If you need to go live quickly, PHP 7.4 is the safest choice.
Q: How do you handle the market data source?
A: The source package includes a data ingestion interface layer. You can connect to third-party public market APIs, or write a simulated data generator like I did. For teaching and demo scenarios, simulated data works fine. You can generate fluctuation curves using a normal distribution with random perturbations, and it looks quite close to real market data.
Q: Is the payment module required?
A: If you are only running demos and teaching, the payment module can be turned off entirely through a switch in the admin panel. If you want to enable paid membership features, the source code supports common third-party payment gateways, and you just need to configure the merchant ID and secret key.
One last reminder: with source code like this, please make sure to follow all local laws and regulations. Use it only for technical learning, teaching demonstrations, and compliant data visualization projects. Any illegal or non-compliant use is prohibited. This article is for technical education only. Technology is neutral, and it only creates value when applied in the right context.
Disclaimer: This article is for technical education and demonstration only. It is not professional or financial advice. Any real-world deployment must comply with applicable laws and regulations.
#uniapp #market data visualization #source code deployment #Vue #PHP
-
 Alipay QR Code Scan
-
 WeChat Scan Pay