
Building a Financial Data Visualization System: Multi-Asset Market Simulation and Admin Panel Deployment Notes
Building a Financial Data Visualization System: Multi-Asset Market Simulation and Admin Panel Deployment Notes
Disclaimer: This article is for technical education and demonstration only. It is not professional or financial advice. Any real-world deployment must comply with applicable laws and regulations.
I recently spent about two weeks deploying a multi-asset market simulation demo system for a client who builds financial data showcases. The requirement was clear: a demo platform that simulates real-time market data for multiple assets, works on both PC and mobile, has a full admin backend, and supports multi-level agent permission distribution. The source code uses NodeJS + MongoDB + Redis, a common stack, but deploying it cleanly turned out to be trickier than expected. Here is a module-by-module breakdown of what I learned.
System Architecture and Module Testing
The source code is split into clearly separated folders: API server, order matching and demo settlement engine, market data center, site admin backend, agent admin backend, wallet service, and Android/iOS projects. Each module lives in its own directory, so coupling is low and future customization is easier.
Mobile approach: both iOS and Android use a WebView hybrid app wrapper rather than native code. The upside is fast development and one codebase for both platforms. The downside is performance: long lists can feel choppy. If the budget allows, I would rewrite only the K-line chart in native code and keep the rest in WebView.
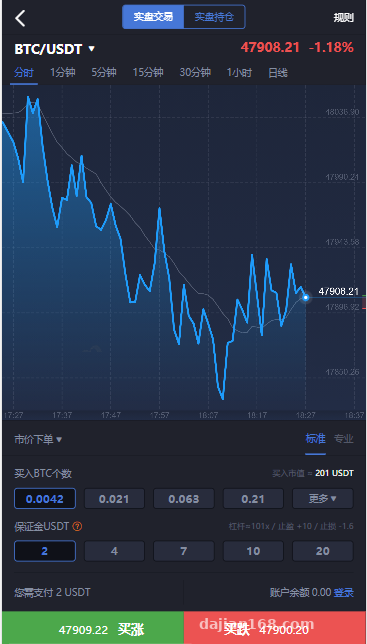
Market data center: this is the core of the system. It supports mainstream digital asset symbols like BTC, ETH, BCH, LTC, and XRP, with K-line, depth chart, and time-and-sales views. The system does not generate its own prices; it pulls from public market data APIs for demo purposes, and demo settlement is based on this index price. That avoids data distortion when a single source goes stale.
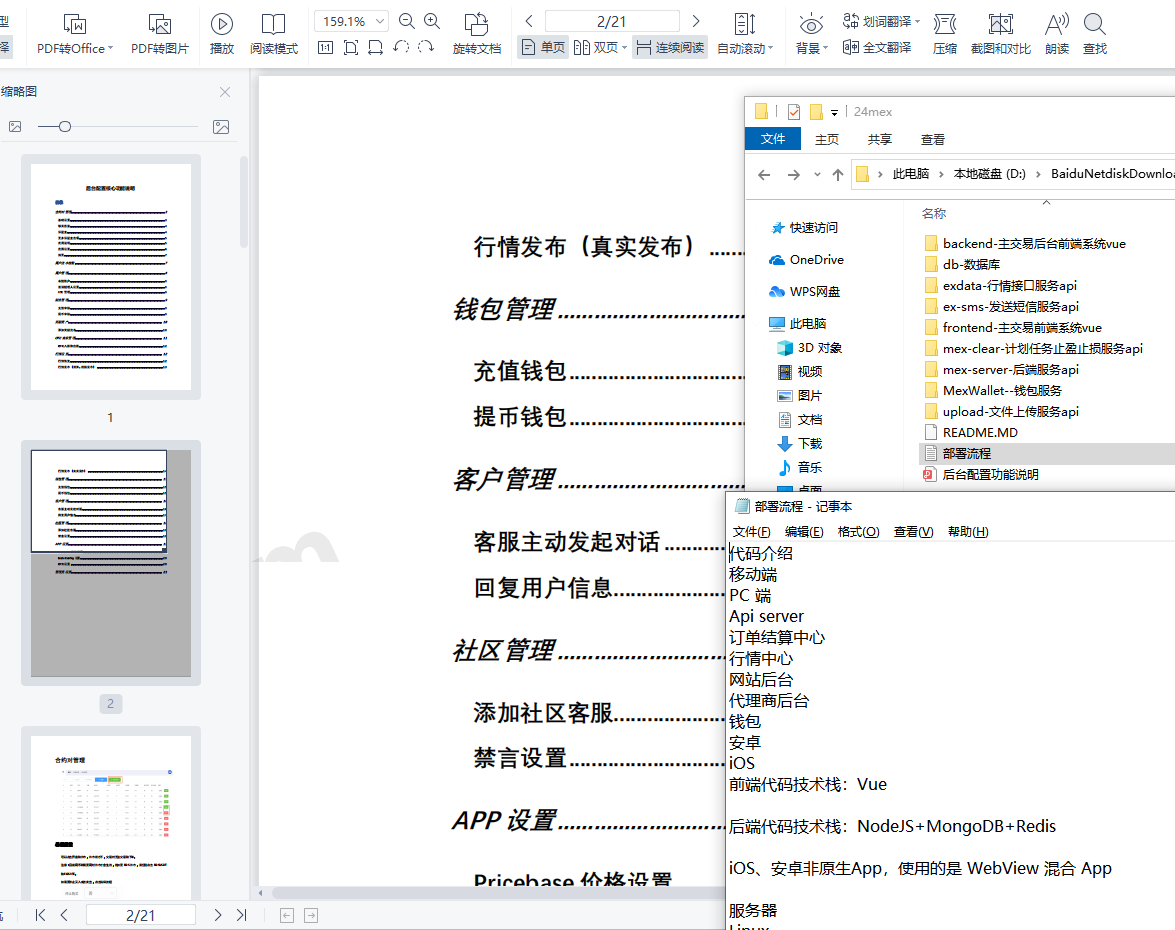
Order matching and demo settlement engine: this part is complex. It supports long/short demo positions, configurable minimum margin ratio down to 1%, and leverage up to 100x in demo mode. Order matching runs inside this engine, and the results are synced to the market data center and wallet service.
Admin Backend in Practice
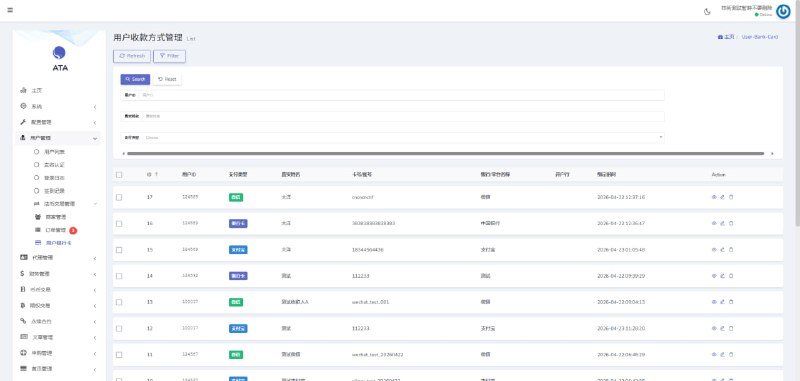
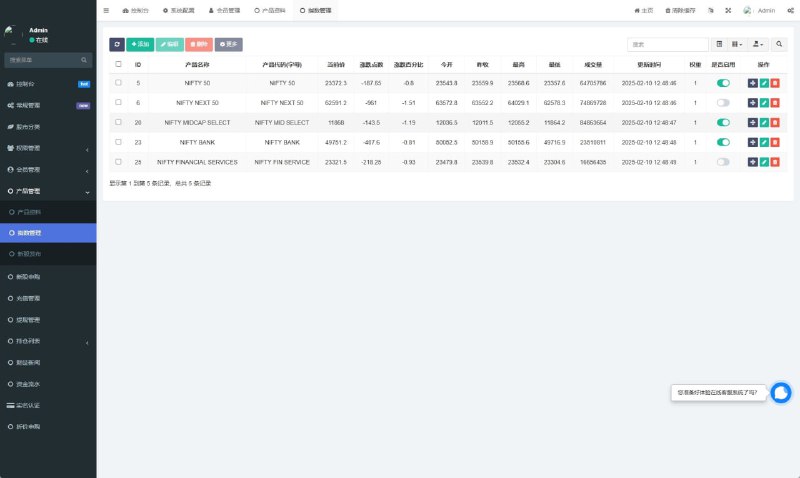
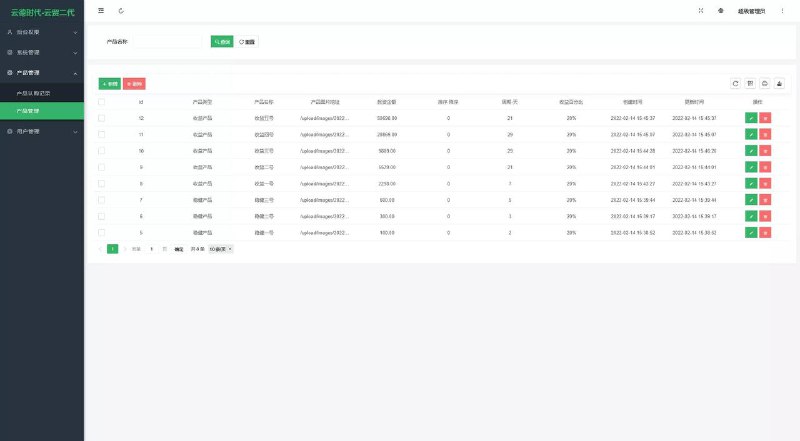
The site admin and agent admin are two separate portals. The site admin is for the operator: user management, order management, and balance movement records. The agent admin is for sub-agents and is scoped to their own users and orders. The permission isolation is decent.
⚠️ Pitfall warning: test the agent admin permission checks thoroughly. During deployment I found one endpoint that did not filter by data scope, so an agent could see platform-wide orders. Adding an
agent_idmiddleware fixed it.
Deployment Notes and Configuration
For the environment I used CentOS 7.9. NodeJS should be 14.x or newer; older versions choke on ES6+ syntax. MongoDB 4.4 and Redis 6.x worked for me. Version mismatches cause compatibility issues, especially with Redis Cluster.
Key configuration items:
- Enable MongoDB replica sets; single-node mode chokes under concurrent load.
- Redis stores sessions and market data cache; give it at least 2 GB of RAM.
- Run the market data center as a separate process. It is CPU-intensive, so do not share the same server with the API server.
- Deploy the order matching and demo settlement engine separately and use PM2 to keep it alive.
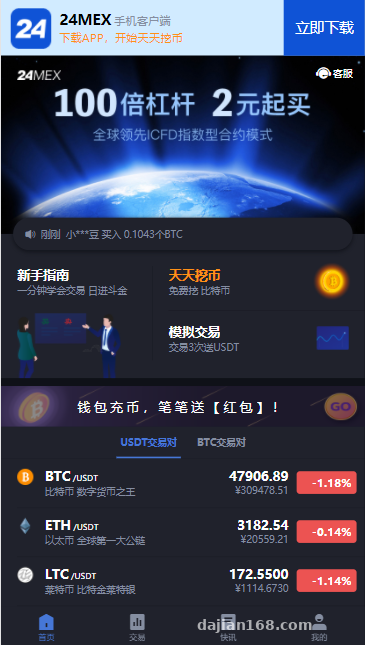
On the WebView hybrid app side, update the API URL in config.js to the production domain, and change the Android package name and iOS Bundle ID, otherwise app review will stall. For the H5 static assets, set up a dedicated Nginx virtual host with gzip compression; it noticeably improves mobile first-screen load time.
Security Settings for Demo Mode
Because this is a demo system, all order placement, matching, and balance changes run in a sandbox environment and do not connect to real payment gateways or banking APIs. Still, you must implement API signature verification, HTTPS transport, and password salting. The default settings in the source code are for testing only and must be changed before any public release.
Who This Fits and How to Customize It
This system fits financial data visualization demos, market simulation training, and internal education scenarios. If you want to use it as a compliant financial data visualization platform, you will need to modify a few things:
- Remove all endpoints that involve real money flows, keeping only the demo data features.
- Label the user agreement clearly as a demo system and prohibit any illegal or non-compliant use.
- Add a demo-mode toggle in the admin panel so operations can control it.
- Replace the market data source with a public, compliant API.
For customization, I would start with the agent admin backend. Its business logic is generic and easy to modify. Next, look at the K-line rendering in the market data center. The default uses ECharts. Switching to TradingView Lightweight Charts would take roughly three to five days.
You can repackage the mobile WebView shell with HBuilderX by editing permissions and splash screens in manifest.json; this is much simpler than editing in Android Studio.
FAQ
Q: What server specs does this system need?
A: It will run on 2 cores and 4 GB of RAM, but if the order matching and demo settlement engine and the market data center run together, start with 4 cores and 8 GB. A dedicated MongoDB server is more stable. Bandwidth depends on concurrency; 5 Mbps handles roughly 1,000 simultaneous users.
Q: Can a WebView hybrid app be published on app stores?
A: Yes, but you need to polish the native shell: add a splash screen, fix white-screen issues, and handle the back button properly. Android review is more lenient; Apple is stricter, so prepare a demo account for the reviewer.
Q: What should I watch when connecting the market data source?
A: Use a compliant public API, limit request frequency, and add retry logic. I once hit a case where the API returned empty payloads, and without fallback the K-line chart broke. Adding a cache fallback fixed it.
Q: Can agent admin permissions be customized?
A: The source code includes basic role-based permissions and menu toggles. For finer data-level control, such as limiting an agent to certain symbols under their own users, add filtering logic in the middleware layer. It is not a huge task.
Q: How do I run load tests after deployment?
A: Use wrk or JMeter against the endpoints. Focus on the market data center and the order matching engine. Order matching is CPU-bound; a single process reaches about 200–300 QPS, so run multiple processes to distribute load.
Overall, this system works well as a financial data visualization demo platform. The stack is mainstream, the modules are cleanly separated, and there is plenty of room for customization. The source code is average in quality, with few comments but readable structure. If you plan to use it for teaching demos or internal training, do one more security hardening pass before going live.
Disclaimer: This article is for technical education only. The described system is a demo environment for learning and research, not a production financial service. Please follow all applicable laws and regulations.
Disclaimer: This article is for technical education and demonstration only. It is not professional or financial advice. Any real-world deployment must comply with applicable laws and regulations.
#Financial Data Visualization #Market Simulation #NodeJS Deployment #WebView Hybrid App #Admin Management System
-
 Alipay QR Code Scan
-
 WeChat Scan Pay



![? [New UI NFT Blockchain Trading System] NFT Minting + Blind Box Synthesis + NFT Marketplace + Digital Art Collectibles](https://dajian168.com/wp-content/uploads/2025/07/telegram-img-2025-07-08-686ce28de969c.jpg)