Financial Data Visualization System Build Log: Vue + Java, Multi-Asset Market Simulation and Admin Dashboard
Financial Data Visualization System Build Log: Multi-Asset Market Simulation + Admin Dashboard
Disclaimer: This article is for technical education and demonstration only. It is not professional or financial advice. Any real-world deployment must comply with applicable laws and regulations.
Recently I helped a fintech presentation client deploy a multilingual market-data visualization system. The client did not need a live securities platform; they wanted an internal training and roadshow demo environment. The stack is Vue on the front end, Java on the back end, fully open-source, and K-line data comes from a third-party paid API. I took notes during deployment for anyone who wants to fork it or use it as a demo site later.
Feature Walkthrough: Simulation, Not Live Trading
I treat this system as a market-data simulation and training platform. The point is not real order matching, but stitching together visualization, K-line playback, demo-account management, and IPO dashboards into one place for presentations and teaching.
Multilingual Frontend and Market Dashboard
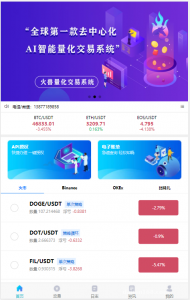
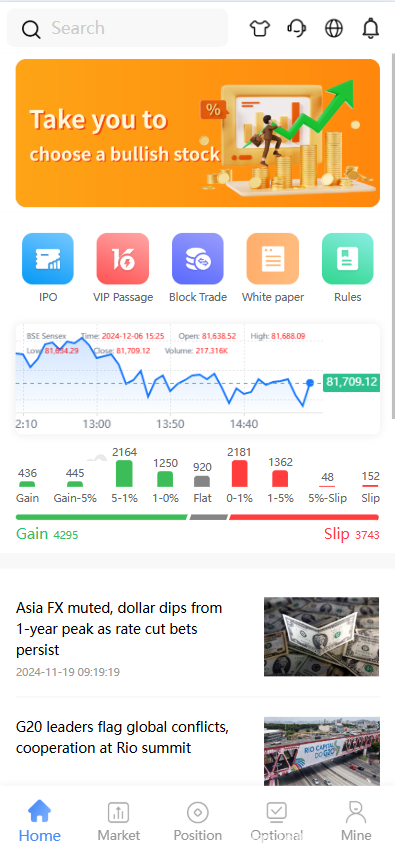
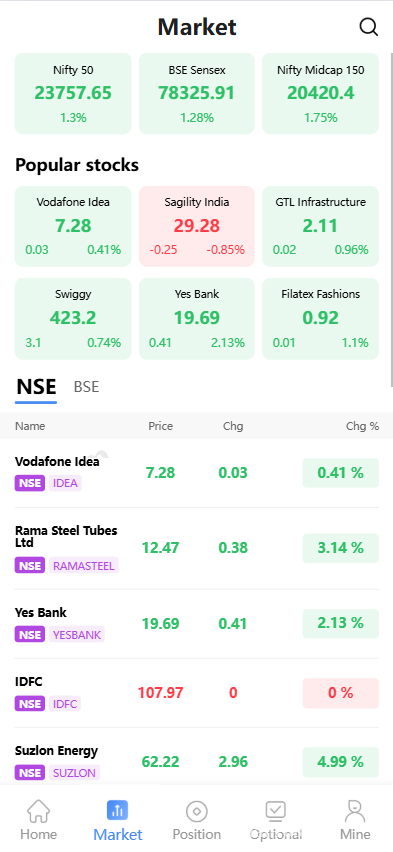
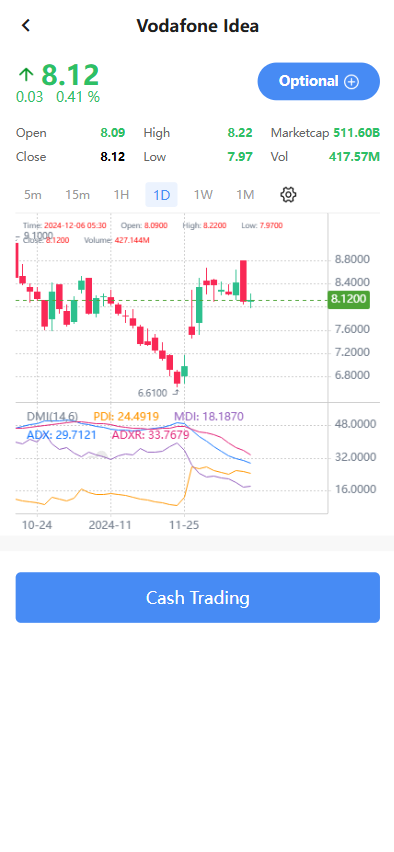
The frontend is a Vue SPA with Chinese/English language switching. The home market dashboard lists asset cards—U.S. equities, India market, Hong Kong equities, etc.—showing last price, change percentage, and volume. Clicking a card opens a candlestick chart with intraday, daily, and weekly views. Data is fetched from a paid third-party API; the token is configured on the Java backend.
Admin Dashboard
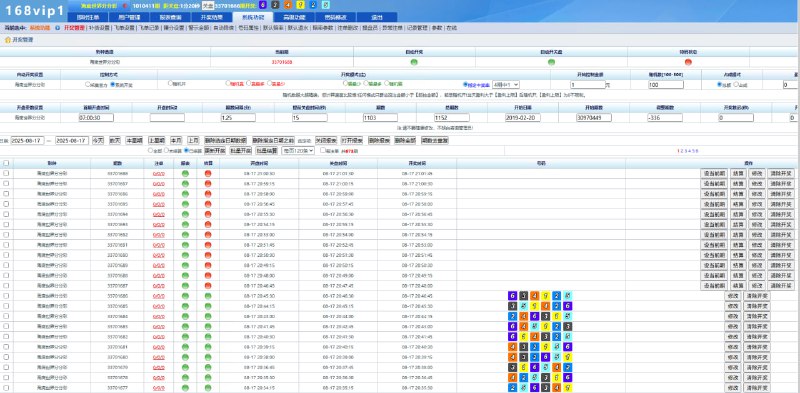
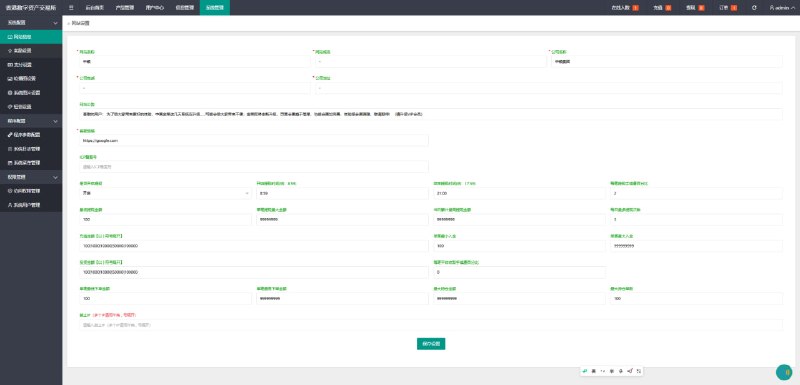
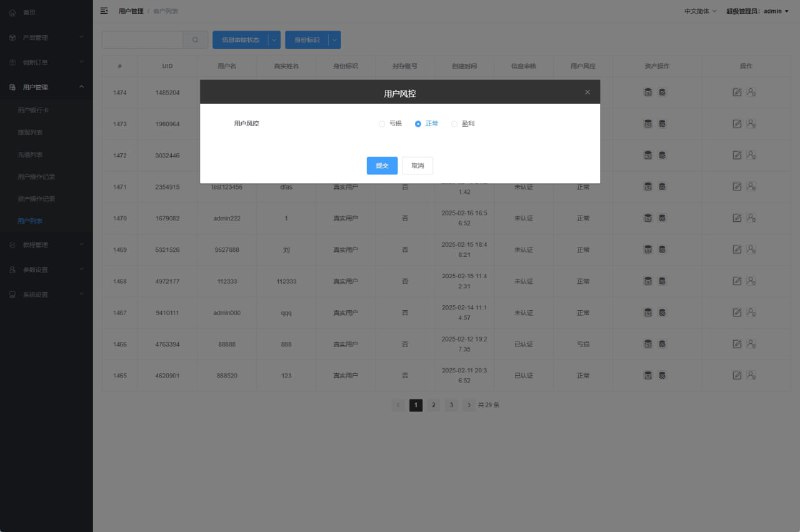
The admin UI is a separate frontend page. Logging in with the admin account exposes modules for user management, asset configuration, announcements, banners, logs, and permissions. The useful bits:
- User management: registration, groups, demo wallet balance allocation
- Asset configuration: enable/disable market modules, rename and reorder cards
- Announcements & banners: maintain homepage banners and notices
- Logs & permissions: operation records and menu-level permissions down to button level
Demo Trading, IPO, and Block-Trade Modules
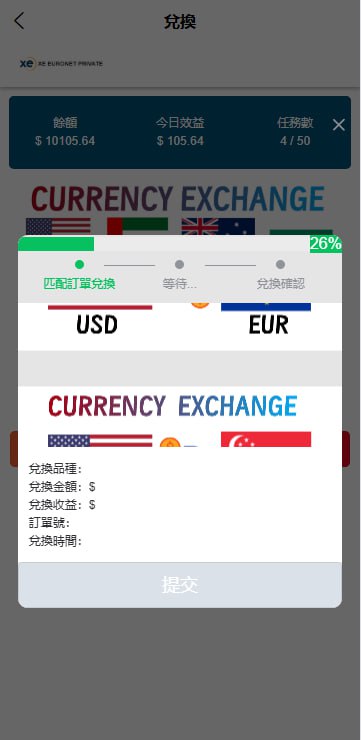
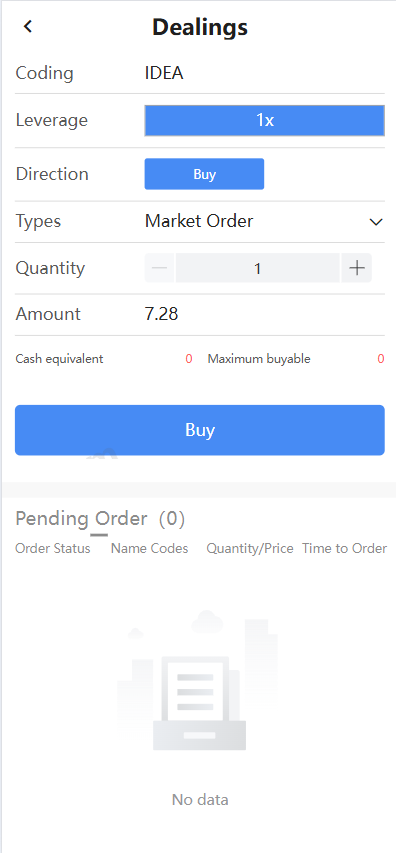
The demo-trading module assigns virtual funds to users for simulated buy/sell orders, tracking positions and P/L without moving real money. The IPO module shows new-issue calendars and basic profiles. The block-trade module displays sample block-trade market data. These are useful for roadshows and financial-education scenarios.
Important: All trading, profit/loss, and market data in this system are for technical demonstration and training only. It does not connect to real securities accounts, and no real-money outcomes are implied. Please comply with applicable laws and regulations, and do not use the system for any illegal or unauthorized purpose.
Deployment Notes: Vue + Java Split Architecture
Environment Versions
The server can run CentOS 7 or Ubuntu 20.04. The frontend needs Node.js 16+; install dependencies with yarn or npm, build, then serve via Nginx. The backend is Spring Boot, requiring JDK 1.8+, MySQL 5.7+, and Redis for caching and sessions. The admin frontend and backend deploy separately, with Nginx proxying /api to the Java service.
K-Line Data API Configuration
K-line data comes from a paid third-party API. In application.yml set the market API endpoint, token, historical-data cache switch, and refresh interval. The default refresh is five seconds. Watch the request-rate limit: use Redis to cache the last few minutes of market data so you do not exceed the quota.
Database and Backend Settings
After importing the SQL file, change the default admin password first. The backend supports multilingual term management, trading-hours templates, and homepage module toggles. The wallet top-up module is for virtual-balance recharge only and can optionally integrate a third-party payment SDK, but it is strictly for demonstration and does not perform real settlement.
Who It Is For and How to Extend It
This system fits fintech firms needing a demo, training organizations building education platforms, university capstone projects, or internal data-visualization initiatives. There is plenty of room to extend:
- Replace the paid K-line API with local historical JSON for a pure offline demo
- Add technical indicators such as MACD, RSI, and Bollinger Bands
- Expand into a multi-asset simulation covering funds, FX demo data, etc.
- Connect to a BI dashboard for large-screen display
Deployment Pitfalls I Hit
CORS Issues
Split front/back ends almost always run into CORS. I recommend configuring CORS centrally in the backend rather than relying only on Nginx add_header, which can trip you up on OPTIONS preflight requests.
Timezone Drift in Market Timestamps
Some market APIs return UTC timestamps. Convert them to the local timezone in the backend, or opening/closing times will display incorrectly on the frontend.
Frontend Build Runs Out of Memory
Building the Vue project on a small server can OOM. Set NODE_OPTIONS=–max-old-space-size=4096 before running the build command.
FAQ
Q: Can this system be used for real stock trading?
A: No. It is a market-data simulation and visualization platform. It has no broker interface and does not handle real funds. Real securities trading is not supported and is prohibited.
Q: Is the K-line data API paid?
A: The source code defaults to a paid third-party market-data API. To save costs, you can fork it to read local JSON mock data, which is enough for demo scenarios.
Q: How long does deployment take?
A: With experience, environment prep, source deployment, and API configuration take about half a day. First-time compilation and data sync may add another two hours.
Q: How do I add a new language?
A: Use the backend internationalization term manager, then add the corresponding JSON file in the frontend i18n folder and restart the frontend.
Q: Is mobile supported?
A: The frontend is responsive, but the market dashboard is best viewed on a PC. For mobile, you can build a separate H5 or mini-program.
Disclaimer: This article is for technical education and demonstration only. It is not professional or financial advice. Any real-world deployment must comply with applicable laws and regulations.
#Financial Data Visualization #Market Data Simulation #Vue Open Source #Java Backend #K-Line Data Integration
-
 Alipay QR Code Scan
-
 WeChat Scan Pay