Financial Data Visualization System Build Log: Multi-Asset Market Simulation + Admin Panel Deployment Notes
Financial Data Visualization System Build Log: Multi-Asset Market Simulation + Admin Panel Deployment Notes
Disclaimer: This article is for technical education and demonstration only. It is not professional or financial advice. Any real-world deployment must comply with applicable laws and regulations.
I recently helped a client deploy a customized build of a financial data visualization demo system, focused on multi-asset market simulation and backend administration. The client wanted the entire front-end UI redone, plus room entry thresholds and dual-language support. Two and a half days of wrangling later, here’s the whole process and the pitfalls I hit, written down to save whoever comes next some time.
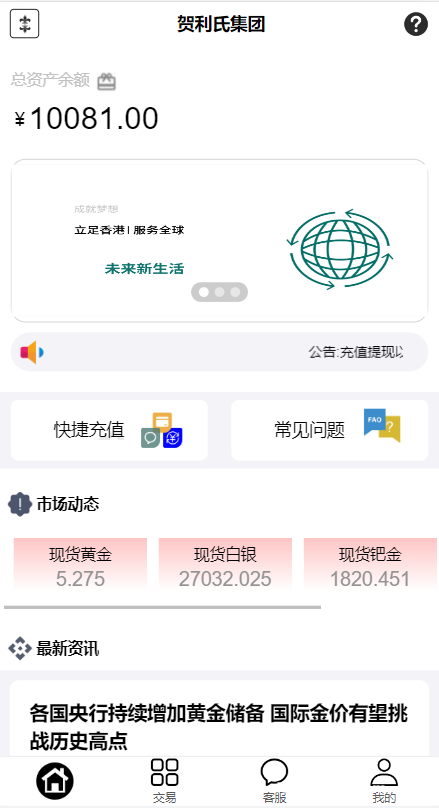
Hands-On Testing: What This Custom Build Changed
The original was a plain market simulation platform. The customized version touches quite a few places, and I tested each one.
Market Simulation and Countdown Result Announcements
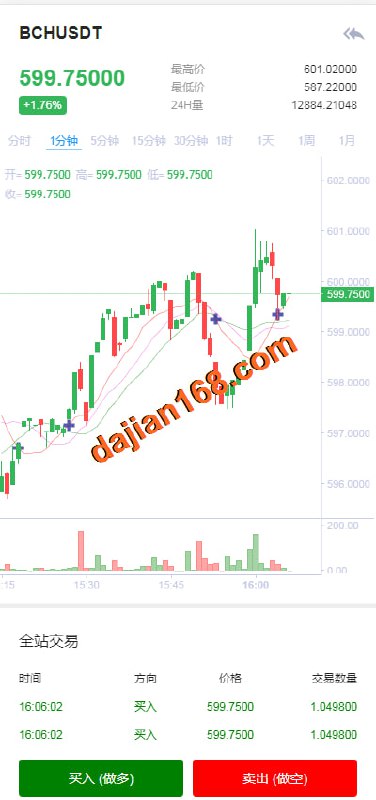
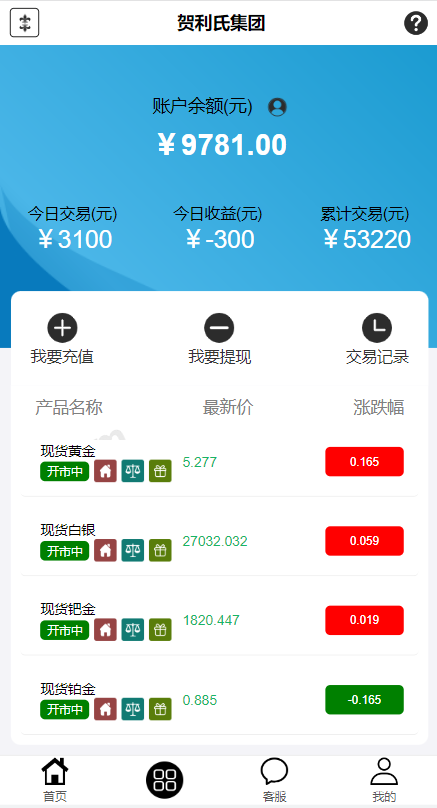
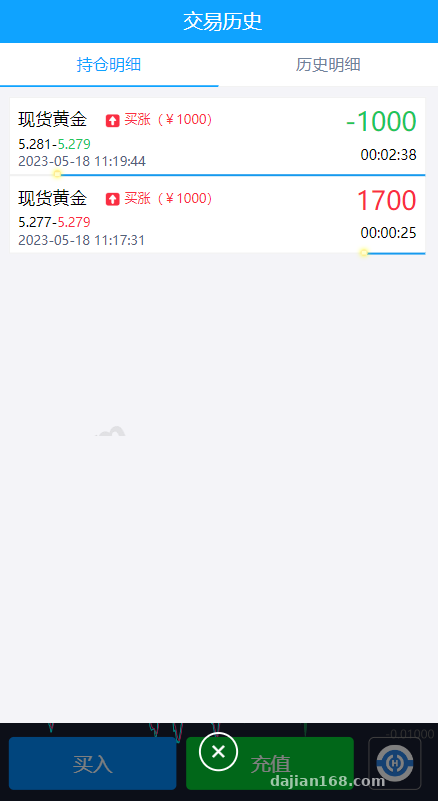
The core is simulated market data: you configure the asset list in the backend, the front end displays live-ticking simulated quotes, and when each round’s countdown ends, results are announced automatically. All data is randomly generated for demonstration purposes, pushed over WebSocket, and the connection survives page refreshes. I stress-tested it: a single machine handled 500 concurrent connections without breaking a sweat; beyond that you’d need more hardware. Countdown accuracy is decent, within one second of error, but server time and client time must be aligned — I had to run an NTP sync once before it stabilized.
Room Entry Thresholds
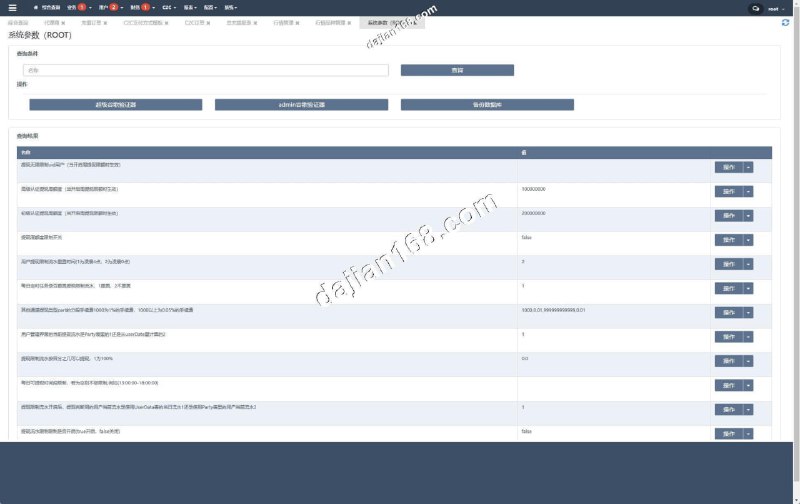
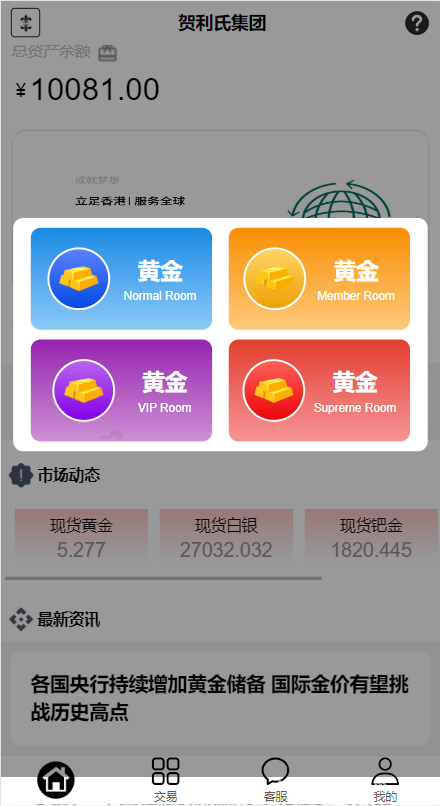
This is new in the customized build. Admins can set an entry threshold for each room — a minimum points balance or a membership level, for example — and users who don’t qualify get a prompt the moment they try to enter. Rooms can be toggled on or off with one click from the backend. During testing I switched one off, and the front end grayed it out within 3 seconds; the push was prompt.
Identity Verification and Article Management
Identity verification works two ways: manual backend review plus an API check. After a user submits their documents, they show up in a pending-review list in the backend. Article management is a lightweight CMS with rich-text support — plenty for posting announcements and demo instructions.
Deployment Essentials and Pitfall Log
Environment Setup
The backend is ThinkPHP. I went with PHP 7.4, MySQL 5.7, and Nginx, all installed via the BaoTa panel (aaPanel). You have to manually select the thinkphp rewrite rules, or the admin panel 404s. Redis is a must — both the queue and the market data push depend on it. Skip it and countdown results lag by several seconds.
Multi-Language Switching
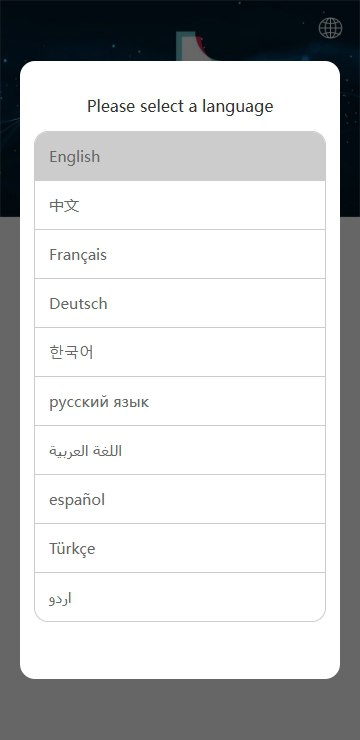
Dual-language support was added in the customization, but the Chinese/English switching logic is commented out in the code, so you have to enable it manually. Find the language section in the config file, remove the comments, and a switch button appears on the front end. Translation files live in the lang directory; add any missing entries yourself. My pitfall: the English language pack was incomplete, so the demo came out half Chinese and half English. Filling in the missing entries took me an entire afternoon.
Payment Interface
The system ships with a unified payment interface reserved for demo-environment flows like membership activation and room threshold checks. Before going live, connect it to a sandbox first, and make sure the callback URL is reachable from the public internet. My callbacks never arrived during local debugging; it only worked once I moved everything to a public server.
One reminder: this system is positioned as a market data simulation and financial data visualization demo. All market data is randomly generated and involves no real transactions of any kind. Before customizing, isolate your data sources clearly — never wire the simulated data into a real market data feed, or you’ll be in for arguments later.
Who This Is Worth the Trouble For
Three groups: anyone teaching financial data visualization, say explaining to students how market data push and countdown mechanisms are implemented; fellow developers taking on customization jobs — the code is fully commented and, after the front-end UI rewrite, the structure is clean, so the cost of further development is low; and teams wanting an internal data dashboard — swap the market simulation module for your own business data source and it just runs.
FAQ
Q: Is the market data real?
A: No. All market data is generated by the system’s random number simulation, purely for data visualization demos and technical education. It connects to no real market data source and offers no real trading functionality.
Q: What server specs do I need?
A: For testing, 2 cores and 4 GB of RAM is enough. For a production demo, start at 4 cores and 8 GB, with at least 5M bandwidth. Redis is mandatory, and PHP shouldn’t be below 7.4. I haven’t tested 8.0 — colleagues report compatibility issues.
Q: How do I enable dual languages?
A: The customized build has the language-switching code commented out by default. Find the language section in the config file and uncomment it. Translation files are in the lang directory; add missing entries yourself.
Q: Can it be further customized?
A: Yes. Front end and back end are separated, the front-end UI is a freshly rewritten structure, and the backend is thoroughly commented — adding room types or changing threshold rules is straightforward. Just get it running in a test environment before going live.
One last note, as always: this system is for technical learning and data visualization demonstration only. Comply with all applicable laws and regulations when deploying and using it, and never put it to any non-compliant use.
Disclaimer: This article is for technical education and demonstration only. It is not professional or financial advice. Any real-world deployment must comply with applicable laws and regulations.
#Build Log #Market Simulation #Financial Visualization #Source Code Deployment #Customization Notes
-
 Alipay QR Code Scan
-
 WeChat Scan Pay
![[Exposing Scammers] Warning everyone to beware of being deceived!](https://dajian168.net/wp-content/uploads/2026/07/dajian168_thumb-300x200.jpg)