Probability Simulation Trend Chart System Deployment Notes: Backend Preset Features Tested on a PHP Data Demo Platform
Probability Simulation Trend Chart System Deployment Notes: Backend Preset Features Tested on a PHP Data Demo Platform
Disclaimer: This article is for technical education and demonstration only. It is not professional or financial advice. Any real-world deployment must comply with applicable laws and regulations.
I recently helped a friend who does data demos deploy a probability simulation system with a trend chart style. The client’s requirements were simple: the backend should let them preset result data, the frontend trend chart should update automatically, and everything needed to look right on both phones and desktops. After spending most of a day on it, I’m writing down the process and the pitfalls so others can save some time.
Bottom line up front: the codebase isn’t complicated — an older PHP + MySQL architecture with a low deployment barrier — but there are a few details you’d never guess without reading carefully. Here they are, one by one.
Feature Testing: What This System Can Actually Do
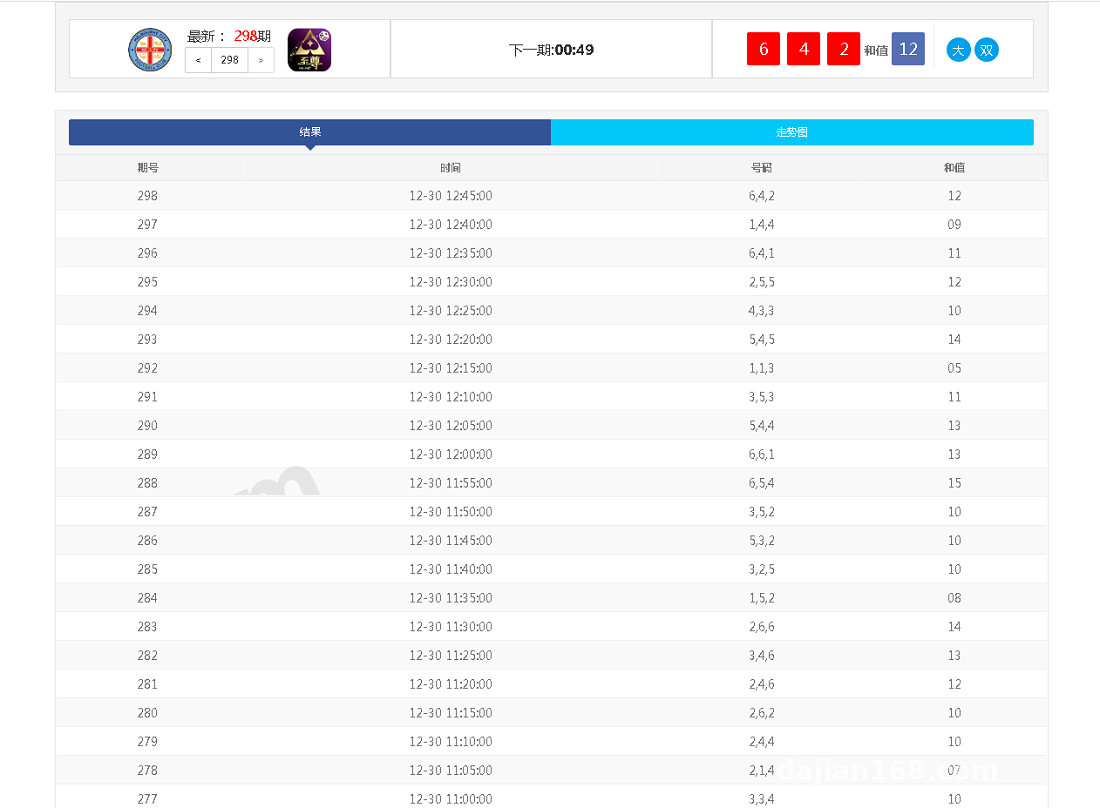
In plain terms, it’s a random number data generation and display platform, with trend chart visualization at its core. After testing, here are the main features:
Backend Data Presets
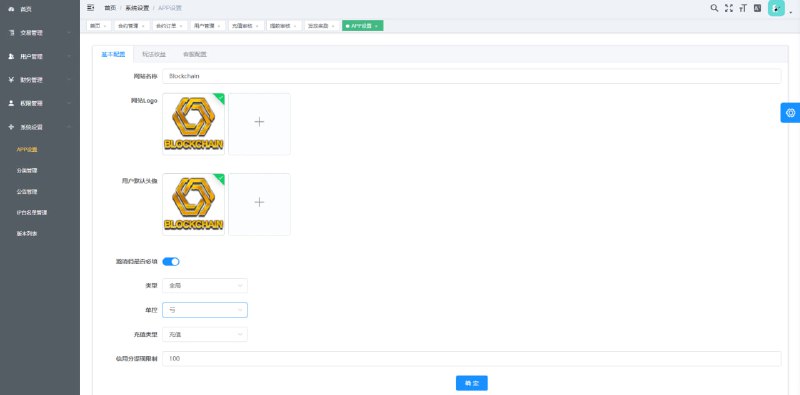
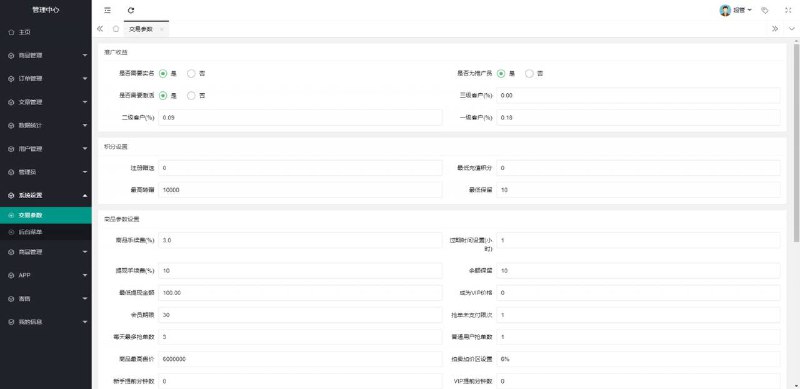
The admin panel lets you manually enter or one-click generate simulated results, and the generation rules support configurable probability weights. In other words, you can set the simulated frequency at which a particular number appears — very intuitive for data demos or algorithm teaching. I changed the weights a few times during testing, and the frontend trend chart updated in real time with no lag issues.
Custom Publishing Times
The interval between rounds is adjustable in the backend, down to minute-level granularity. The scheduled tasks are driven by server crontab — here’s a gotcha: some shared hosting doesn’t support crontab, so you need a pseudo-scheduling approach (triggered by user visits). I’ll cover this in the deployment notes below.
Trend Chart Rendering
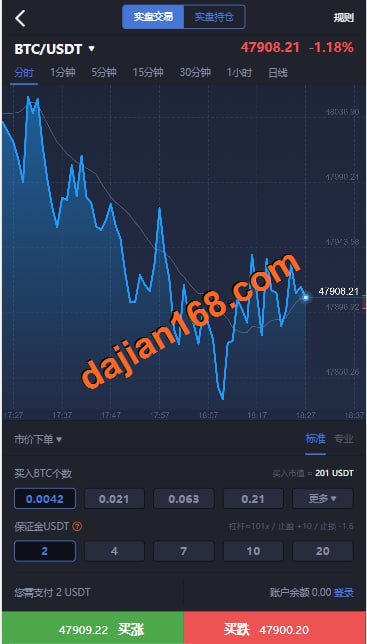
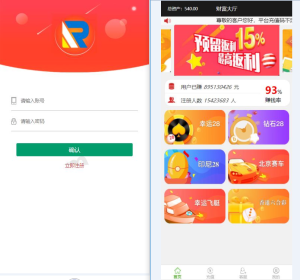
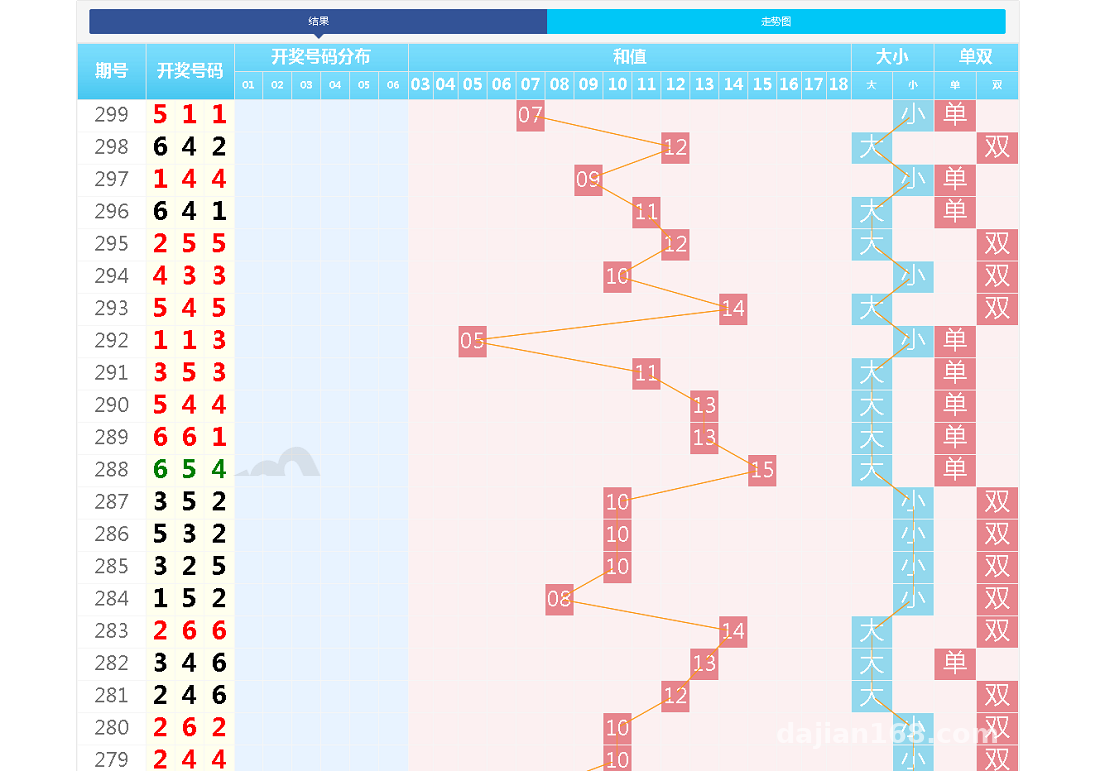
The frontend chart is drawn with Canvas, including sum trends and distribution views. Mobile responsiveness is decent — I tested on an iPhone and a few Android phones without any layout issues. On loading speed, chart data is fetched with pagination, so browsing historical data within 3,000 rounds doesn’t stutter.
Deployment Notes: Every Pitfall I Hit, Listed Here
Environment Requirements
PHP 7.2–7.4 both work; 8.0 and above throws errors on a few deprecated functions, so if you don’t want to touch the code, stick with 7.4. MySQL 5.6+ — remember to change the default charset to utf8mb4 before importing the database, or some data will show garbled characters. For URL rewriting, the standard ThinkPHP rules work fine.
Two Approaches to Scheduled Tasks
Option one: run a script via crontab every minute — stable and recommended. Option two: if you don’t have crontab access, enable the visit-triggered mode in the backend; the downside is nothing updates when nobody visits. I went with option one for the client and added a supervisor daemon — it’s been running a week without a single drop.
Mandatory Backend Security Changes
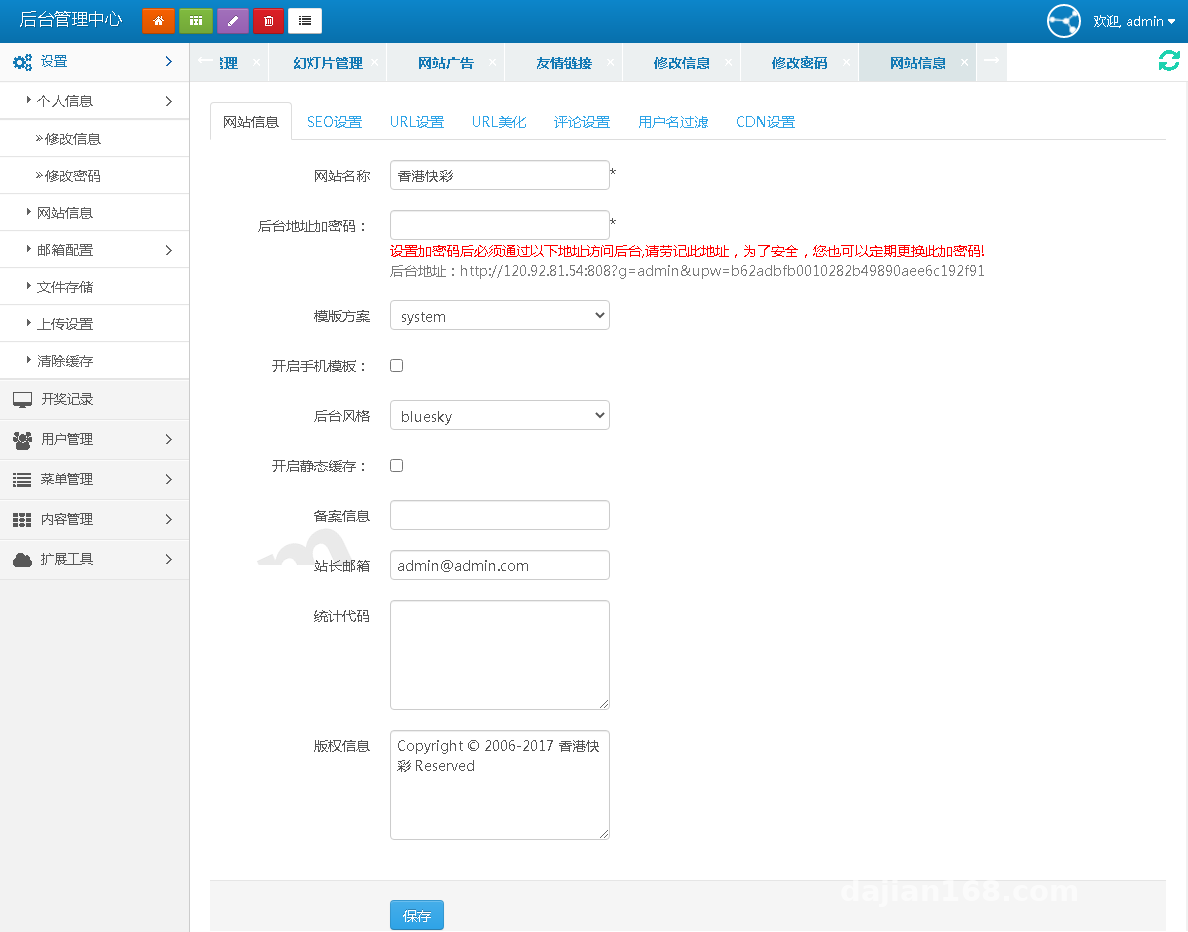
Change the default admin path and credentials immediately — the default password in this codebase is absurdly weak. I’d also suggest adding an IP whitelist for the admin directory at the nginx level as a second layer of protection. I set the session timeout to 30 minutes, which the client found sufficient.
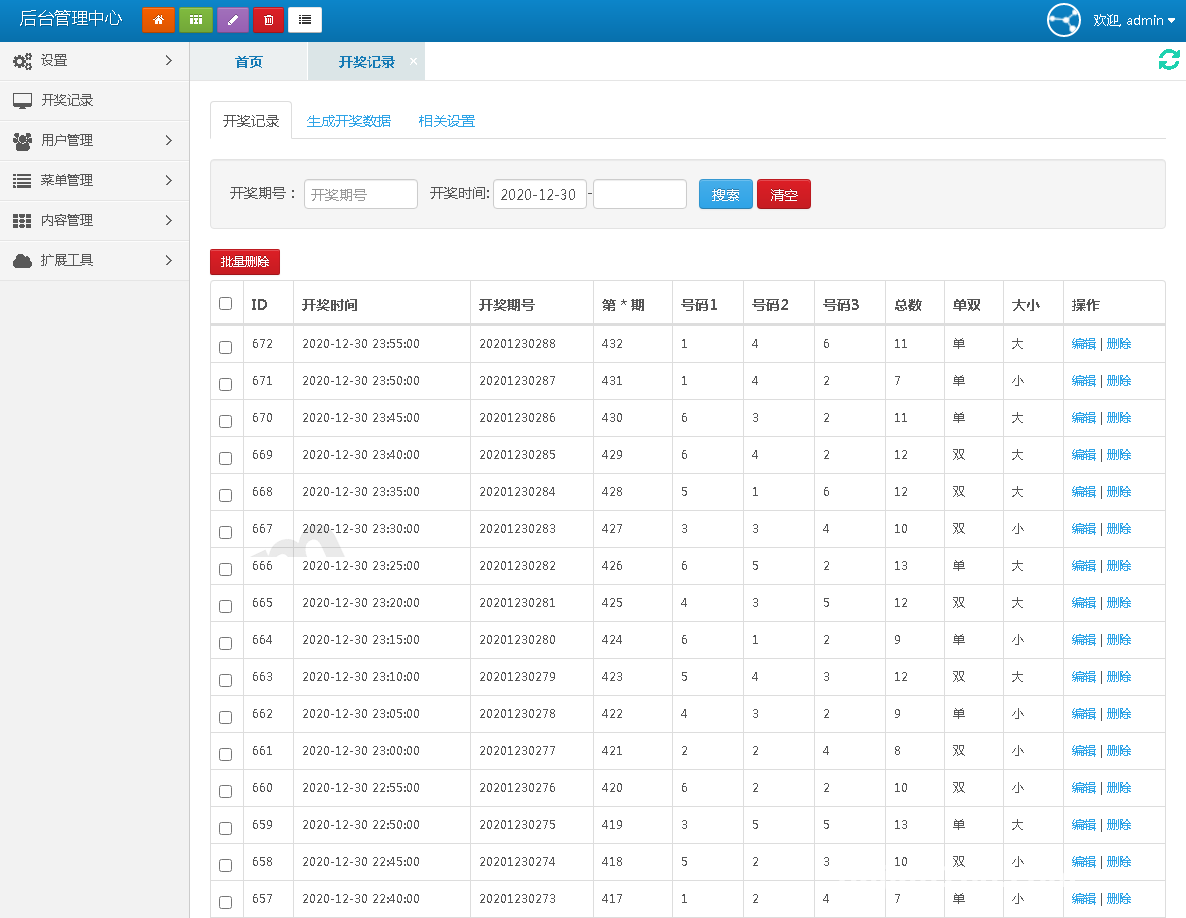
First things after deployment: go into the backend and adjust the preset probability parameters and publishing cycle to your demo needs, then immediately change the default password and admin path. Only after these three steps is it ready to hand over.
Room for Customization: For Those Who Like to Tinker
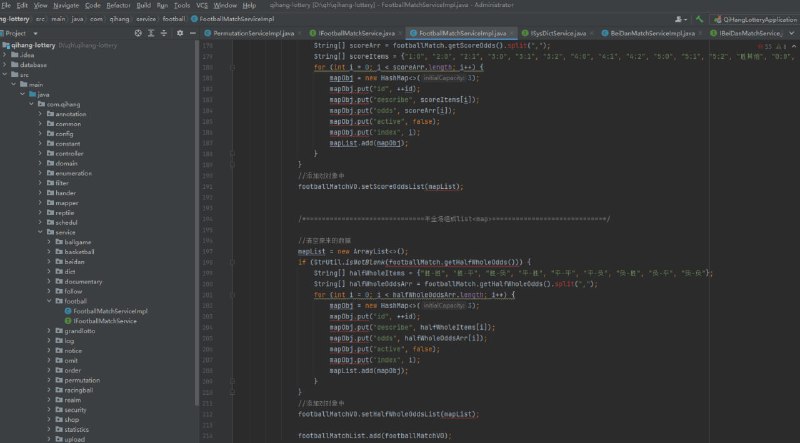
The code isn’t obfuscated, and controllers and templates are separated cleanly. If you want to add multi-language support, the template text is scattered across view files — extracting it into language packs isn’t a big job; it took me about two hours to pull out both Chinese and English sets. Hooking up a third-party data API for real-time market simulation is also feasible — the Model layer has a unified data-write entry point, so integration isn’t hard.
As for payment, the source code only includes a demo mock recharge flow — no real payment integration — which is actually a relief. For a pure demo site, you don’t need to touch the payment module at all.
Who This Is For
People doing random number algorithm teaching demos, frontend learners who need trend chart visualization examples, or developers who want to study the architecture of this kind of data display system. For demo purposes only, one afternoon is enough to get it deployed.
FAQ
Q: What server specs do I need?
A: An entry-level cloud host with 1 core and 2GB RAM is plenty. Demo sites have very low concurrency, and bandwidth of 3M or less runs smoothly.
Q: Can backend-generated data be imported in bulk?
A: Yes. The results table structure in the database is simple — a CSV import script takes half an hour to write. I imported five thousand rounds of historical demo data for a client.
Q: The trend chart is cut off on mobile — how do I fix it?
A: Check the Canvas container width settings in the template. Some older templates hardcode pixel values; changing them to percentage-based responsive widths fixes it.
Disclaimer: This article is for technical education only. The system is intended solely for random number simulation and data visualization demos. Please comply with all applicable laws and regulations when using it, and do not use it for any unlawful purposes.
Disclaimer: This article is for technical education and demonstration only. It is not professional or financial advice. Any real-world deployment must comply with applicable laws and regulations.
#Source Code Setup #Deployment Notes #Trend Chart System #Probability Simulation #PHP Web Development
-
 Alipay QR Code Scan
-
 WeChat Scan Pay